An open benchmark for energy management under uncertainty

Now that I'm back from SGE 2018 conference, I've put online the manuscript of my article and the slides of my presentation (in French).

“Gestion d'énergie avec entrées incertaines :
quel algorithme choisir ?
Benchmark open source sur une maison solaire”

The title in English (translation of the whole article in progress...) is:

“Energy management with uncertain inputs:
which algorithms ?
Open source benchmark based on a solar home”

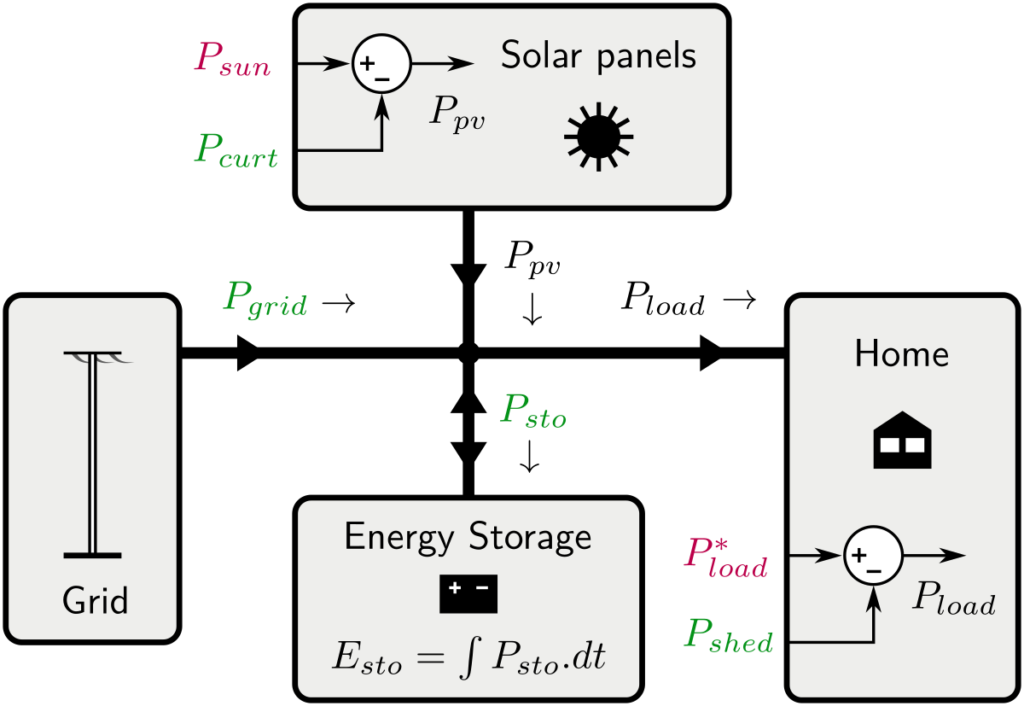
Here is the model of the solar home (power flows)

solar home control bench (power flows model )

I've also a first translation of the abstract:

“Optimal management of energy systems requires strategies based on optimization algorithms. The range of tools is wide, and each tool calls on various theories (convex, dynamic, stochastic optimization...) which each require a period of appropriation ranging from a few days to several months.

It is therefore difficult for the novice energy management practitioner to
understand the main characteristics of each approach so we can compare them objectively and finally find the method or methods best suited to a given problem.

To facilitate an objective and transparent comparison, we propose an exemplary and simple energy management problem: a solar house with photovoltaic production and storage. After justifying the sizing of the system, we illustrate the benchmark by a first comparison of some energy management methods (heuristic rule, MPC and anticipatory optimization). In particular, we highlight the effect of the uncertainty of solar production on performance.

This benchmark, including the management methods described,
is open source, accessible online and multi-language (Python, Julia and Matlab).”

Access to the benchmark

The entire source code and the data (an extract from the Solar home electricity dataset by Ausgrid) is available on GitHub:

https://github.com/pierre-haessig/solarhome-control-bench/

As of now, only rather simple energy management methods are implemented, but I'd like to add some kind of stochastic MPC (once I've clarified what this really means), and later Stochastic Dynamic Programming.
Solar home electricity dataset by Ausgrid

I've started exploring an open dataset that should be very useful for research on residential solar energy (for example studying energy self-consumption with a PV-battery system).

My Python code to manipulate this dataset and some preliminary studies (simple statistics) is freely available on Github: https://github.com/pierre-haessig/ausgrid-solar-data. This data exploration code is extensively using pandas (for slicing, grouping, resampling, etc.).

About the dataset

The “Solar home electricity dataset” is made available by Ausgrid, an Australian electric utility which operates the distribution grid in Sidney and nearby areas.

This dataset contains a pretty rich record:

  • electricity consumption and the PV production
  • of 300 customers (in Sidney and its area),
  • over three years (July 2010 to June 2013),
  • with a 30 minutes timestep.

Here is a small extract of the PV production for 3 randomly chosen customers, over 3 days in July 2011:

https://raw.githubusercontent.com/pierre-haessig/ausgrid-solar-data/master/PV%20production%202011-07%2001-03.png

Many more plots and statistics are given in the Jupyter notebooks available on the Github repository.

Locating postcodes (geocoding)

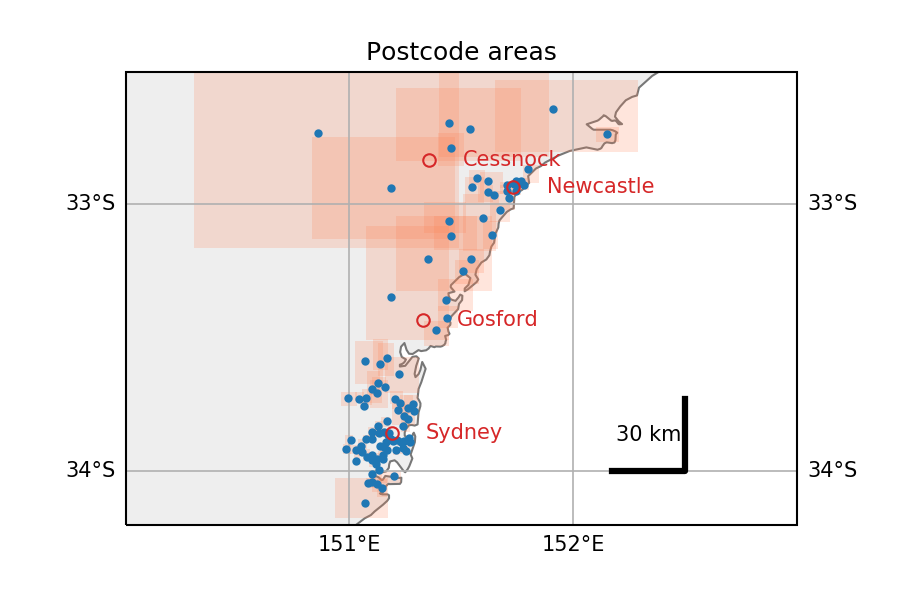
Also, the exploration of this dataset was an occasion to discover the Google Maps Geocoding API. Indeed, the location of each anonymous customer is given by a postcode only. To enable quantitative study of the spatiotemporal pattern in PV production, I've tried to locate this postcodes. The Python code for this is in the Postcodes location.ipynb Notebook. Map plotting is done with cartopy.

Extracted from this notebook, here is an overview of the locations of the postcodes present in the dataset (in Australia, NSW). Red rectangles are the boundaries of each postcode, as returned by Google maps (small in urban areas along the coast, gigantic otherwise).
2019-11-11 update: fixing broken link to dataset webpage on Ausgrid website.

Enjeux énergétiques par le prisme d'objets du quotidien

Dans le cadre de la Journée Nouvelles Technologies du CCMO, j'ai fait une présentation intitulée "Enjeux énergétiques par le prisme d'objets du quotidien". Voici les diapos (pdf).

Cette présentation était à destination d'enseignants de science en lycée. L'idée était d'utiliser des objets de la vie courante (bouilloire, frigo) pour rendre plus concrètes les notions d'énergie et de puissance. Exemple : une batterie de téléphone portable ≈ 5 Wh. En matérialisant ces notions, on peut aider à construire un regard actif/critique sur l'enjeu citoyen qu'est l'énergie.

La présentation comprend aussi une comparaison entre 2 moyens de production autonome d'électricité : groupe électrogène et panneaux photovoltaïques. Coût d'investissement faible pour le groupe électrogène, mais coût élevé du carburant. C'est bien sûr l'inverse pour le solaire : investissement onéreux, mais "carburant" gratuit.

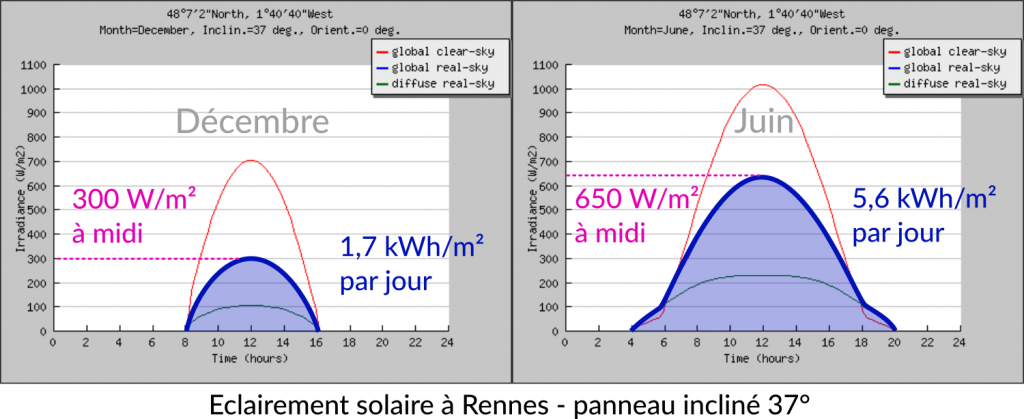
Pour l'analyse de la ressource solaire, j'ai utilisé les graphiques et les données de PVGIS (Photovoltaic Geographical Information System).

Ressource solaire à Rennes d'après PVGIS

Au final en moyenne annuelle, on peut espérer 4 kWh/m²/jour soit 1450 kWh/m²/an. Par rapport au sud de la France, Rennes n'est donc pas si défavorisée, puisqu'on n'atteint en Côte d'Azur "que" 2000 kWh/m²/an (cf. la jolie carte du potentiel de solaire de la France).

Par ailleurs, en préparant cette présentation, je suis tombé sur le blog richement alimenté "Do the Math" de Tom Murphy, professeur à University of California, San Diego, et qui creuse justement la question des enjeux de l'énergie.