I've started exploring an open dataset that should be very useful for research on residential solar energy (for example studying energy self-consumption with a PV-battery system).
My Python code to manipulate this dataset and some preliminary studies (simple statistics) is freely available on Github: https://github.com/pierre-haessig/ausgrid-solar-data. This data exploration code is extensively using pandas (for slicing, grouping, resampling, etc.).
[May 2026 update: download link to a copy of the dataset, no longer available on Ausgrid website https://pierreh.eu/downloads/Ausgrid_solar_home_data.zip]
About the dataset
The “Solar home electricity dataset” is made available by Ausgrid, an Australian electric utility which operates the distribution grid in Sidney and nearby areas.
This dataset contains a pretty rich record:
- electricity consumption and the PV production
- of 300 customers (in Sidney and its area),
- over three years (July 2010 to June 2013),
- with a 30 minutes timestep.
Here is a small extract of the PV production for 3 randomly chosen customers, over 3 days in July 2011:
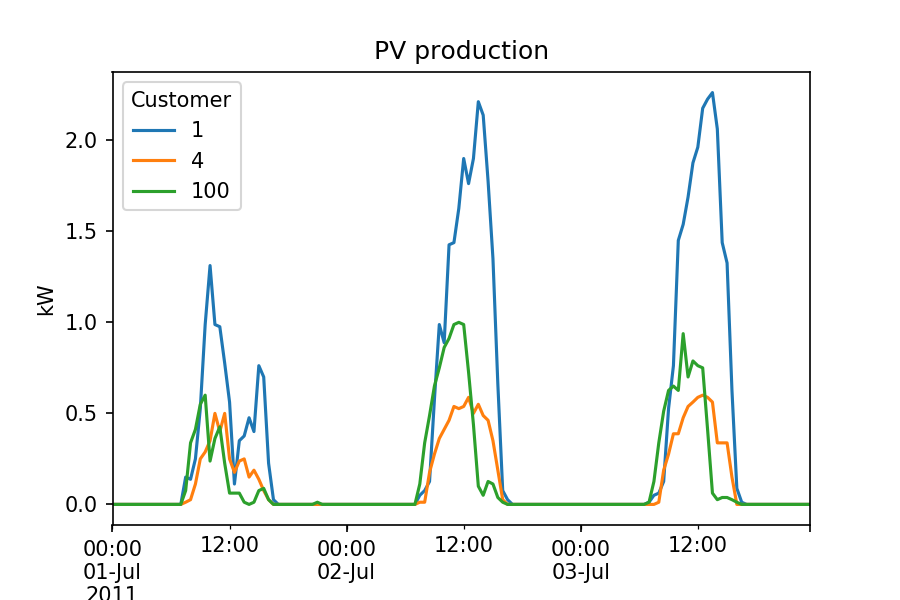
Many more plots and statistics are given in the Jupyter notebooks available on the Github repository.
Locating postcodes (geocoding)
Also, the exploration of this dataset was an occasion to discover the Google Maps Geocoding API. Indeed, the location of each anonymous customer is given by a postcode only. To enable quantitative study of the spatiotemporal pattern in PV production, I've tried to locate this postcodes. The Python code for this is in the Postcodes location.ipynb Notebook. Map plotting is done with cartopy.
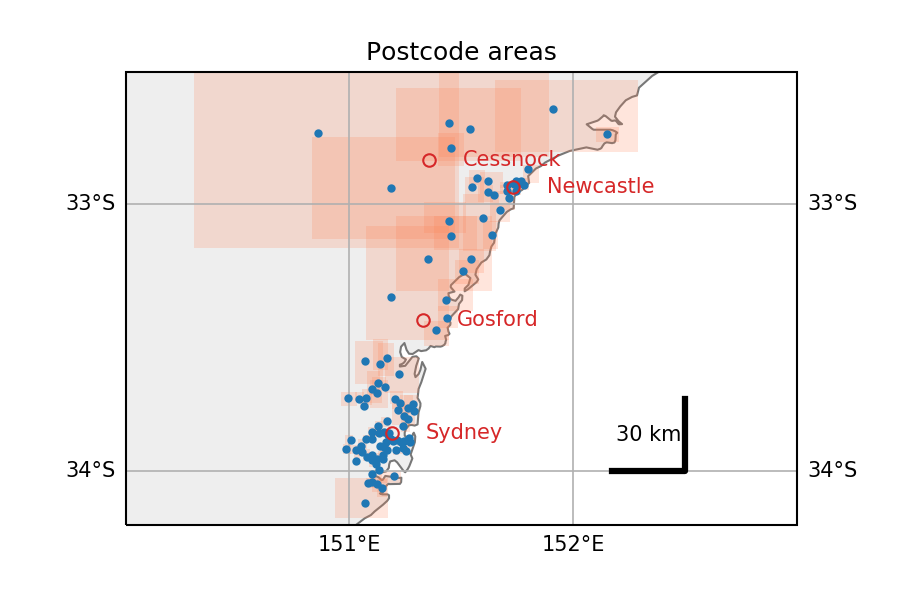 Extracted from this notebook, here is an overview of the locations of the postcodes present in the dataset (in Australia, NSW). Red rectangles are the boundaries of each postcode, as returned by Google maps (small in urban areas along the coast, gigantic otherwise).
2019-11-11 update: fixing broken link to dataset webpage on Ausgrid website.