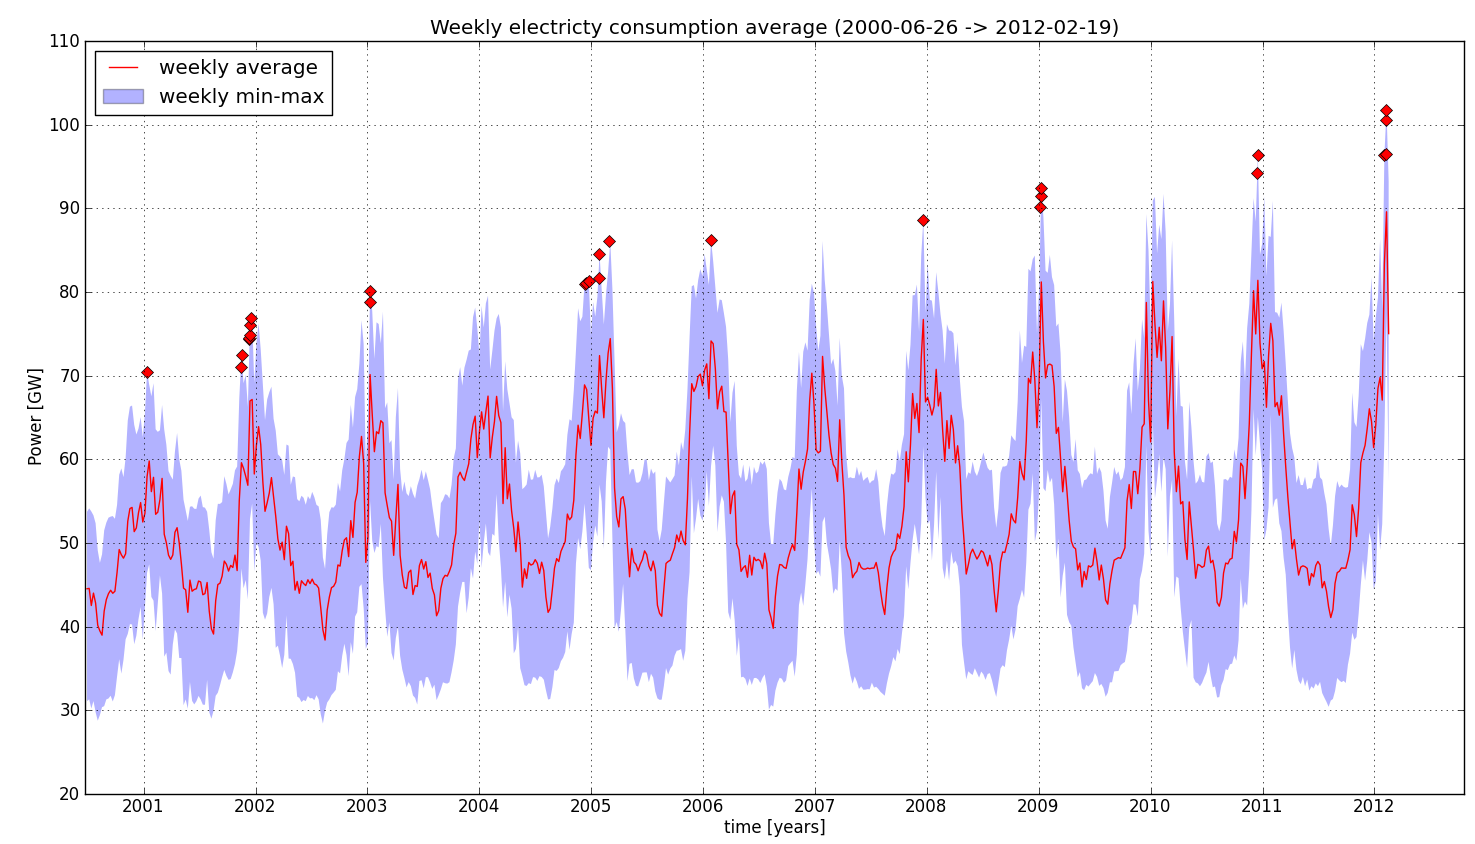
Thanks to the publicly available RTE éCO2mix data about French electricity, I was able to analyze the French electricity consumption since June 24th 2000 (15 minutes time-step averages), that is a bit more than 11 years. This is the first data analysis based on my éCO2mix downloading tool I announced a few days ago. It shows the tremendous increase (44 %) in the peak consumption value over this period.
Note : tools (Python script) and data that generated these curves and tables are openly available on GitHub.
Consumption evolution
To get a glimpse at what is going on with French electricity consumption, here is a plot over those 11 years.

How to read this plot
- The read line shows weekly averages so that weekly and daily variations are smoothed out.
- The light blue shaded region which is the range between min and max consumption during the given week. This gives an idea of intra-week variability that the red curve doesn't show.
- The red diamonds shows the successive consumption records (see below)
Pattern and trend
On this plot, one can see the seasonal consumption pattern which is basically:
- less consumption during summers
- more consumption during winters
The reason for this being roughly that there is a bigger need for heating and lightning during winter than during summer.
Also, there is a general increasing trend. More precisely, one can see that consumption during summer is just slowing increasing, while winter demand is getting bigger and bigger. I will now illustrate this with the analysis of consumption records.
Consumption records
I searched for successive records in the consumption data (starting June 2000). I found 27 records ("I" being my Python code...) which are all listed in the table below. All records (but one) happened around 7pm in winter, that is during the so called "evening peak", when people come back home and put both heating and lighting on (and start watching TV...).
Also, all these records happened during weekdays other than Saturday or Sunday. This is related to the weekly pattern which contains a significant drop on weekends.
A tremendous increase of peak demand
If I summarize these successive records over the years, here is what I get :
- During Winter 2000-2001, the highest peak was 70.5 GW (at 7pm on Tuesday January 9th, 2001)
- During Winter 2005-2006, the highest peak was 86.2 GW (at 7pm on Friday January 27th 2006)
- During Winter 2011-2012 an historical record was set at 101.7 GW (at 7pm on Wednesday February 8th, 2012)
This is +44 % increase in peak demand, which I feel is quite huge over this not-so-long period of 11 years. This requires the commissioning of new dedicated power plants to avoid black outs during winter.
Rationale for this increase
I'm not a specialist of this topic, but the basic idea is that this tremendous increase is French specific (if compared to similar European countries like Germany or UK).
It comes from the fact that a high proportion of house heating is electric (around 30 %, and even more in new buildings). Each new building with an electric heating system is prone to be an additional peak load during winter, and they are a lot.
This is summarized by the "thermal sensitivity" of French electricity consumption : there is an increase of +2.3 GW each time the outside air temperature goes down by 1°C. In Germany, it is only +0.5 GW...
And why do French people rely so much on electric heating ? Perhaps because of the price and also the culture of "cheap nuclear electricity". French regulated price for electrical energy is about 0.11 €/kWh for residential customers (including taxes). The regulated price has been frozen for some years by the French government to avoid angering people. Also, the installation cost of electric heaters is lower than of a fuel/gas based central heating system.
However, in my opinion, French electricity price is bound to increase of maybe 30 % in the coming years, partly due to the need to either stop or rebuild nuclear power plants. It is sad that a lot of peoplee who will have to pay this extra cost where trapped in the first place by an artificially low electricity price.
Electricity consumption peaks table
French electricity consumption peaks between June 2000 and February 2012 (demand records computed with 15 minutes averages)| Date | Power (GW) | Weekday | Hour |
|---|---|---|---|
| 2012-02-08 | 101.7 | Wednesday | 19:00 |
| 2012-02-07 | 100.5 | Tuesday | 19:00 |
| 2012-02-07 | 96.5 | Tuesday | 09:30 |
| 2012-02-02 | 96.4 | Thursday | 19:00 |
| 2010-12-15 | 96.3 | Wednesday | 19:00 |
| 2010-12-14 | 94.2 | Tuesday | 19:00 |
| 2009-01-07 | 92.4 | Wednesday | 19:00 |
| 2009-01-06 | 91.5 | Tuesday | 19:00 |
| 2009-01-05 | 90.2 | Monday | 19:00 |
| 2007-12-17 | 88.6 | Monday | 19:00 |
| 2006-01-27 | 86.2 | Friday | 19:00 |
| 2005-02-28 | 86.0 | Monday | 19:15 |
| 2005-01-26 | 84.6 | Wednesday | 19:00 |
| 2005-01-25 | 81.7 | Tuesday | 19:00 |
| 2004-12-22 | 81.3 | Wednesday | 19:00 |
| 2004-12-15 | 81.1 | Wednesday | 19:00 |
| 2004-12-09 | 80.9 | Thursday | 19:00 |
| 2003-01-08 | 80.1 | Wednesday | 19:00 |
| 2003-01-07 | 78.8 | Tuesday | 19:00 |
| 2001-12-17 | 76.8 | Monday | 19:00 |
| 2001-12-13 | 76.1 | Thursday | 19:00 |
| 2001-12-12 | 74.8 | Wednesday | 19:00 |
| 2001-12-11 | 74.5 | Tuesday | 19:00 |
| 2001-12-10 | 74.3 | Monday | 19:00 |
| 2001-11-15 | 72.4 | Thursday | 19:00 |
| 2001-11-14 | 71.0 | Wednesday | 19:00 |
| 2001-01-09 | 70.5 | Tuesday | 19:00 |